Applications and Services
Contact: Cécile Tourrel-Cuzin
All of the flow cytometry techniques can be applied in so far as the laser and the configuration of the optical filters of the cytometry are compatible with the fluorochromes used.
1/ Analysis of cell components:
DNA (study of cell cycle, viability, proliferation…)
RNA
proteins
Phenotyping: expression of membrane and/or intracellular antigens.
2/ Analysis of cell functions:
Ionic flows (Calcium…)
modification of pH
variation in membrane or mitochondrial potential
apoptosis (Annexin V/Propidium Iodide assay)
cytokines and enzymatic activities.
3/ Analysis of transfected cells
EGFP
mCherry…
All of the measurements can be associated to each other and in certain cases accompanied by cell sorting.
The list above is not exhaustive. We can help you to process research protocols (choice of fluorochromes, sorting conditions and treatment of samples sorted).
Some examples of applications
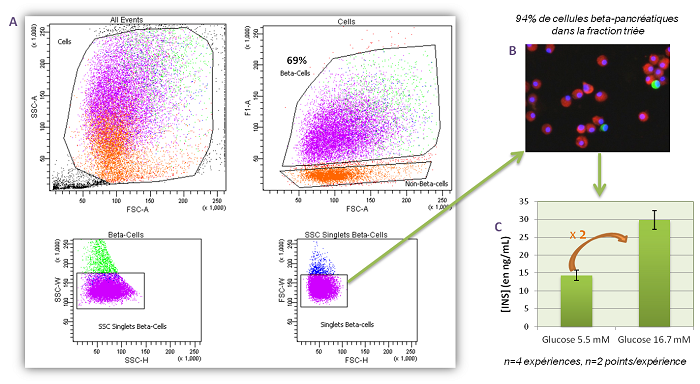
1. Sorting primary pancreatic beta cells
• Sorting of primary pancreatic beta cells of rats using cytometry based on their size (FSC) and their autofluorescence (F1) after elimination of cell doublets (Fig. A).
• Verification of the purity of sorting by immunofluorescence after marking the cells with anti-insulin-RhodamineX and anti-glucagon-Alexa488 antibodies (Fig. B).
• Verification of the function of the cells sorted by dosing with insulin secreted in response to a base concentration (5.5 mM) and stimulating in glucose (16.7 mM) (Fig. C).
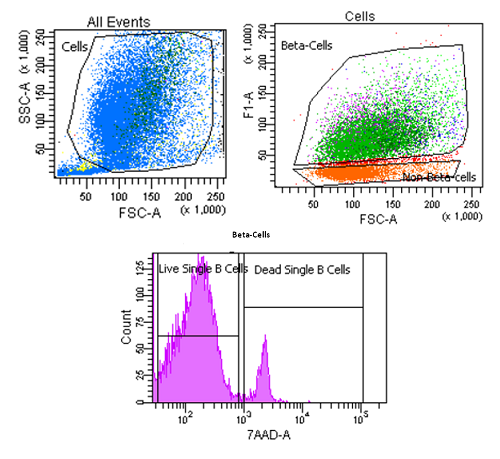
2. Analysis of pancreatic beta cell viability by 7-AAD marking
• Primary pancreatic beta cell from a rat marked using 7-AAD (7-Amino-Actinomycin), cell viability marker inserted in the double helical DNA.
The cells are incubated for 10 mins at a ratio of 0.1 µg of 7-AAD per one million cells.
3. 3. Analysis of cell death and apoptosis
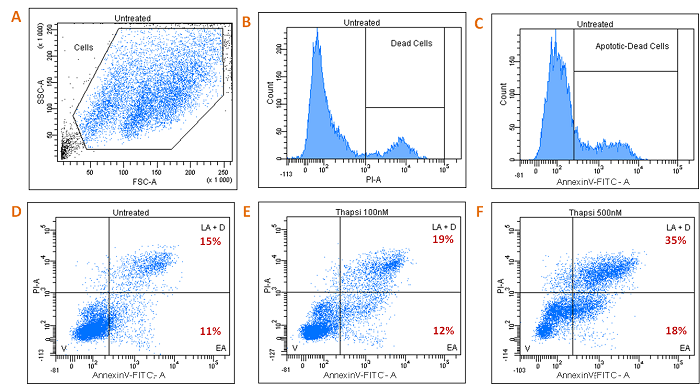
3.1/ Analysis of apoptosis and cell death on INS-1 cells by Annexin V-FITC and Propidium Iodine (PI) co-marking.
• INS-1 cells (pancreatic beta cell lines from rats) producers of insulin, untreated insulin (Figs. A, B, C, D) or treated by induction of apoptosis in 100 nM Thapsigargin (Fig. E) or 500 nM (Fig. F).
V: Viable Cells, EA: Early Apoptotic Cells, LA: Late Apoptotic Cells, D: Dead Cells.
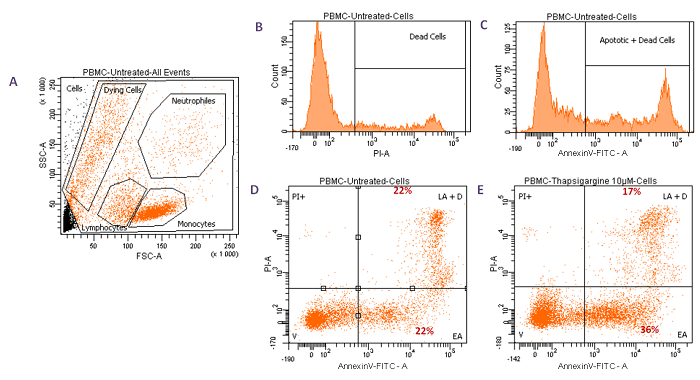
3.2/ Analysis of the apoptosis and cell death of PBMC cells by Annexin V-FITC and Propidium Iodine (PI) co-marking.
• Untreated Peripheral Blood Mononuclear Cells (PBMC) (Fig. A, B, C, D) or treated by induction of apoptosis in 10 µM Thapsigargin for 4 hours (Fig. E).
V: Viable Cells, EA: Early Apoptotic Cells, LA: Late Apoptotic Cells, D: Dead Cells.